

Immersive Analytics
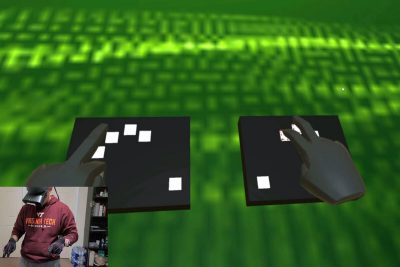
We present a novel approach to visual analytics in immersive mixed reality environments. Traditionally, when it comes to exploring data, visualization is the norm. Desktop-based approaches are used in general to analyze data and find correlations in datasets. Our research focuses on using a human-centered approach to visual analytics. Leveraging human bodies and multiple senses to interact with the data opens up new possibilities for exploratory data analysis in novel ways. With the recent advent of new technologies, it is now feasible to make a system that allows humans to play with data in various tangible and creative ways. With this in mind, and based on an extensive literature survey, we develop a prototype using a Microsoft HoloLens 2 device that allows embodied interaction with different kinds of 2D and 3D data visualizations in a mixed reality space.
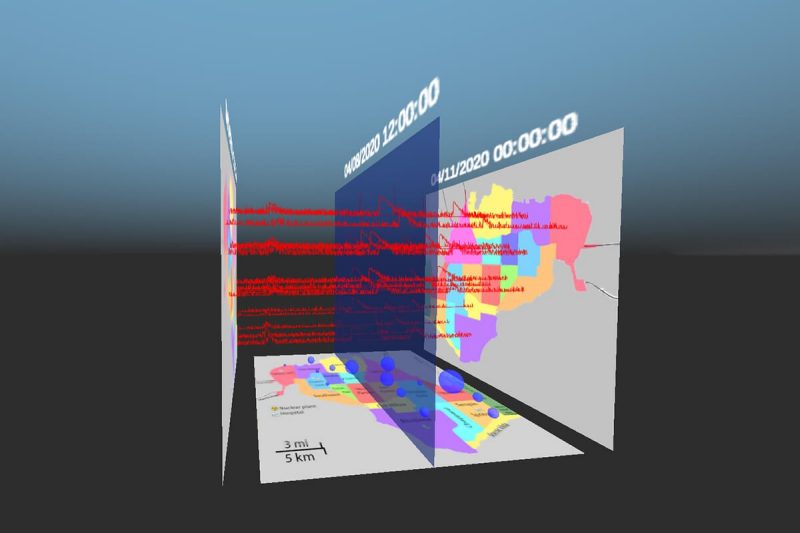
We use the IEEE Visual Analytics Science and Technology (VAST) challenge 2019 dataset to develop our prototype. The dataset is representative of the damage caused to a city in the aftermath of an earthquake. The developed prototype aims to help the city authorities and the overwhelmed emergency services understand the situation on the ground to deploy the limited resources available to them in the best possible way.
While some of the data are inherently spatial, some of the data elements are abstract, e.g., power, water, and sewer damage reports by the citizens on a Likert scale. Therefore, we use the multiple coordinated views approach from traditional information visualization to link and position various 2D and 3D views leveraging the surrounding space. The multiple coordinated views can be resized, rotated, and placed anywhere in the space using hand gestures, allowing users to have a personalized organization of views. Voice commands are enabled to show and hide various plots such as bar charts, 2D histograms, and scatterplots.
The interaction with this prototype is enabled via a slicing plane that allows users to navigate along the time-axis using hand gestures. This navigation allows users to display dynamic data as compared to a static data frame. The user-controlled video-like visual analytics approach in a mixed reality environment is one of our research's main contributions.
We also use spatial sound to enhance the data analysis process.
The primary reason for adding sound is because our eyes can only see in front, but our ears can hear all around. Studies have also shown the usefulness of parallel listening in case of busy visualizations and the auditory modality being superior in finding temporal changes compared to the visual stimuli. Therefore, we use auditory icons to sonify the data attributes as well as the aggregated data.
We deploy our system using a browser setup (WebGL) for a comparative visual analytics study between 2D and 3D environments. The interactions with the slicing plane use keyboard and mouse controls. The sound of various data attributes in different views is enabled in this prototype. We also use a Web Speech API to enable voice commands to provide the same modes of interaction, i.e., visual and aural, in both environments.
Related Content
-
General Item
-
General Item
-
General Item
-
General Item
-
General Item
-
General Item
-
General Item
-
General Item
-
General Item
.jpg.transform/s-medium/image.jpg)

%20(1).jpg.transform/s-medium/image.jpg)
.jpg.transform/s-medium/image.jpg)
.jpg.transform/s-medium/image.jpg)

PRESENTERS
- Disha Sardana
- Sampanna Kahu
ORGANIZATION
Interdisciplinary Graduate Education Program (IGEP)