Epiphany Machine

Description
Dance is a human behavior that evolved for the purposes of social cohesion or bonding, with recent research showing that dance enhances neural coupling or the synchronicity of brain activity between two individuals. Traditionally, the brain has been studied in stillness, but recent advances in Mobile Brain Body Imaging (MoBI) have enhanced our ability to study the moving brain of not only one but two or more individuals during interactive experiences. epiphany machine is a work of contemporary dance and neuroscience research that explores how to express the brain activity of two dancers during performance. Through the process of creating this artistic work, the team is researching how movement states affect electroencephalography (EEG) data and how mediated representations (sonic and visual) of that data affect our understanding of the human brain engaged in choreographic and kinetic thought.
Documentation
Reports
The team’s work on epiphany machine has been multifaceted in recent months, involving the following: the engineering, networking and software development needed for real-time electroencephalography (EEG) data streaming; the visualizations and sonifications of the neural activity; and the overall performance design of the resultant work of choreography.
In regard to the real-time EEG data streaming portion, Basso and English have considered several avenues to allow for brain data to be visualized and sonified without artifact and delay. During each weekly rehearsal time period, we have dedicated time to identifying best practices for real-time EEG data. One of our first major hurdles is that we want to present the most artifact-free signal so that we are presenting true brain data rather than artifacts (e.g., motion artifacts, eye blinks or movement). Another major hurdle is streaming the data without significant delay so that the audience members can connect what they are seeing and hearing to what is actually happening in the brain at that moment in time. We considered using RecView, a software program designed for real-time analysis of EEG data; however, we found that the lag time increased substantially as the preprocessing steps increased. Instead, we have decided to use BrainRecorder in combination with Remote Data Access Client for Matlab. We have settled on our preprocessing steps, which will happen online. In real-time, our plan is to conduct a band-pass filter (1-45 Hz) along with a notch filter (60 Hz). We will exclude channels where any eye blink/movement artifacts will be detected (Fp1, Fp2, and other frontal electrode sites). We will then conduct a sliding window fast fourier transform (SFFT) to assess the power in frequency ranges including delta (1-4 Hz), theta (4-8 Hz), alpha (8-12 Hz), and beta (12-35 Hz). A trigger will be sent to the visualization platform to indicate when a particular power level is reached in each of these frequency bands. This technique is similar to a neurofeedback approach and will serve to indicate to the dancers and audience members when particular brain states are reached. We anticipate that the lag time will be less than 100 ms from when the activity is generated from the brain to when the data is analyzed. We have additionally added School of Neuroscience graduate student, Chelsea Buhler, who will be helping to code this portion of the task.
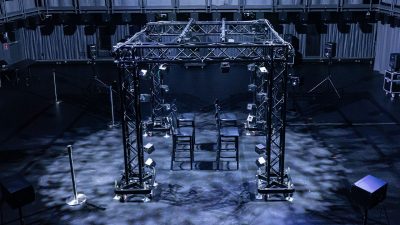
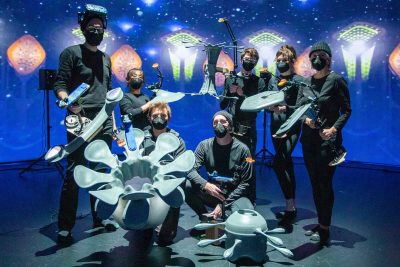
To visualize the neural activity, Duer built two real time applications. The first, in the Unreal Engine, receives data from Matlab through the OSC protocol. The data represents a stream of amplitudes derived from an FFT applied to each of the 32 EEG sensors on each of the performer’s heads. The amplitudes are mapped to the scale of invisible spheres which float on the surface of a pool of virtual water. As the invisible spheres rapidly fluctuate in scale, they perturb the water’s surface creating ripples that visually match the amplitudes of the incoming data. The second visualization application creates a colorful faux-analog glitch landscape of jagged and pulsing shapes. This visualization probably won’t be driven directly by the raw data, but instead have changes be triggered by values derived from the data that indicate shifts in activity between the alpha, beta, gamma, and delta bands between the two dancers in an attempt to visualize the dancers’ changes in interactive states. The visualizations are projected onto the half-cylinder cyclorama screen installed in the Sandbox to create a large-scale immersive stage for live performance.
In terms of performance design, we’ve started to think choreographically about sections that represent different neural states in dance. This will involve sections of pure improvisation performed out of sync, sections of strictly choreographed sequences performed in unison, and several other states of connectivity between the performers that include sustained eye contact and moving with eyes closed, which we’ve observed both have an impact on neural activity in specific wavelengths. Our plan for the beginning of the Spring semester is to begin our studio rehearsal period, with data gathering during each movement session. Our target date for the performance of the final work is on April 13th as the culmination of the New Music + Technology Festival.
Impact
Related Projects
-
General Item
-
General Item
-
General Item
-
General Item